
Rize Capital Ltd is an independent NinjaTrader vendor and affiliate. We may earn a commission if you register through our NinjaTrader referral link. Trading carries risk. Always trade responsibly.
William Fractal - NinjaTrader 8 Indicator
 |
| Image - 1 (Click to ZOOM) |
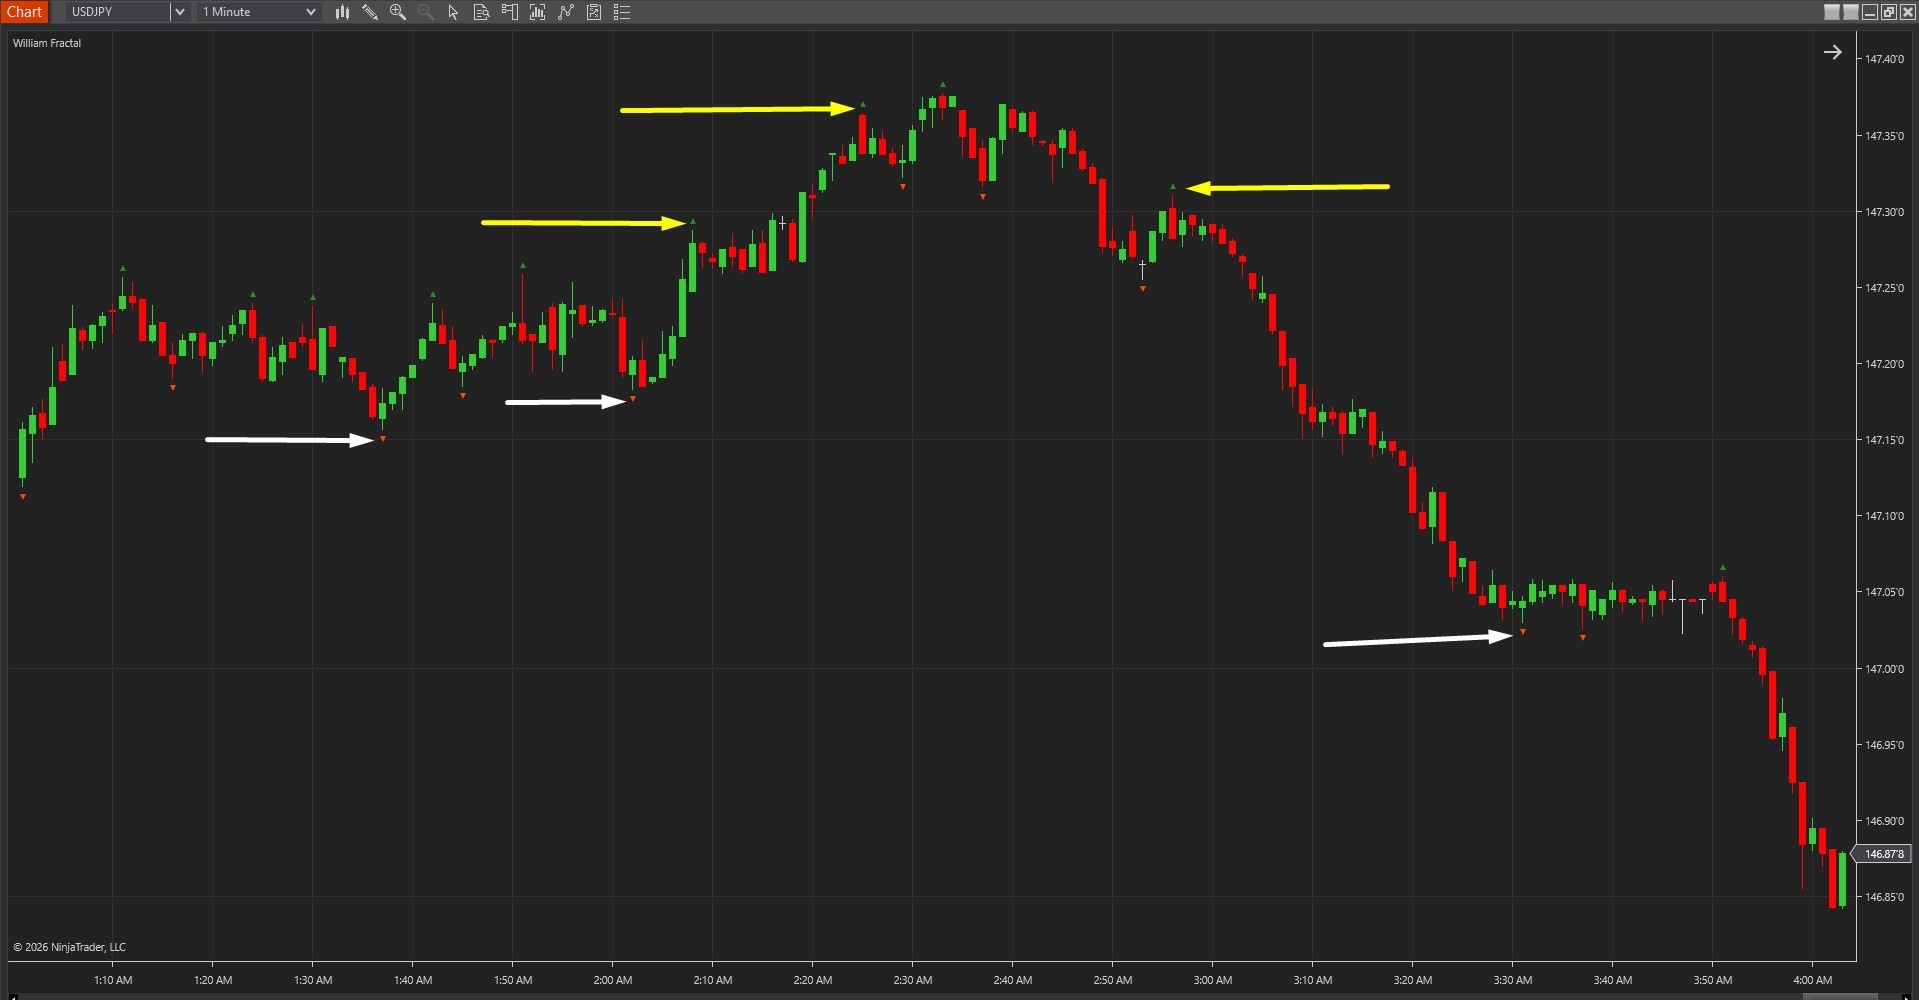
The William Fractal Indicator for NinjaTrader 8 specialises in confirmed swing structure identification by marking swing highs and swing lows only after validation through left-right bar comparison, automatically plotting visual markers at pivot points that represent confirmed changes in price direction rather than speculative predictions. The core functionality revolves around objective pivot detection combined with programmatic accessibility that makes swing structure data available for both visual analysis and automated strategy integration.
As shown in Image 1 (pointed by yellow arrows), green upward-pointing triangles appear at confirmed swing highs—pivot points where the middle bar's high exceeds both the left-side bars and right-side bars by the configured strength parameter. These high pivot markers represent validated resistance points where price temporarily topped before reversing lower. Orange-red downward-pointing triangles (pointed by white arrows) mark confirmed swing lows—pivot points where the middle bar's low falls below both surrounding bar lows, representing validated support levels where price temporarily bottomed before reversing higher.
The visual framework maintains chart clarity by plotting only confirmed pivots that meet strict validation criteria. Markers appear with slight offset from price action (configurable via triangle offset parameter) to ensure visibility on volatile instruments without obscuring candlestick patterns. This clean presentation allows traders to quickly identify market structure, recognise trend direction through pivot sequences, and spot potential reversal zones where price tests previous pivot levels.
 |  |
| Image - 2 (Click to ZOOM) | Image - 3 (Click to ZOOM) |
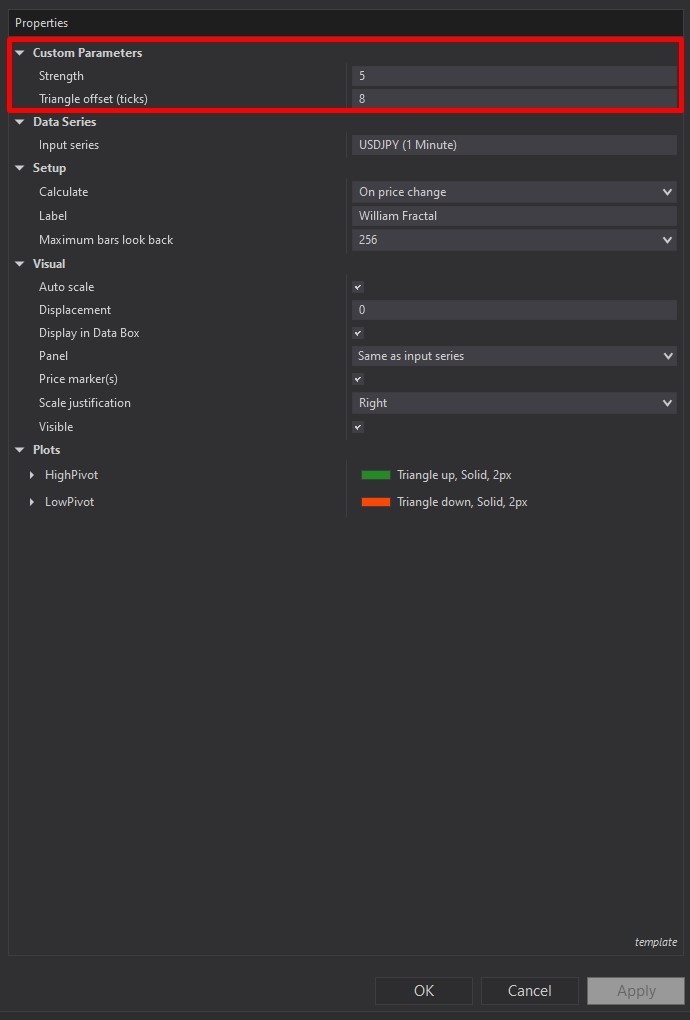
William Fractal offers straightforward yet powerful customisation through its settings panel. The Parameters section, highlighted by a red rectangle in Image 2, controls the core confirmation logic. The Strength parameter determines how strict pivot validation becomes—this value specifies how many bars on both the left and right side of the potential pivot must be compared. A strength value of 2 (common default) means the middle bar's high (for swing highs) or low (for swing lows) must exceed or fall below two bars on each side to qualify as a confirmed pivot.
Increasing strength produces fewer, stronger pivots that represent more significant swing points—useful for higher timeframe analysis, swing trading approaches, or filtering minor retracements within trends. A strength of 4 or 5 creates very selective pivot identification, marking only major structural turning points. Lowering strength generates more frequent pivots that capture smaller swings—appropriate for scalping timeframes, intraday mean reversion strategies, or detailed structure analysis. A strength of 1 creates the most sensitive detection, though it may include noise in choppy conditions.
The Triangle Offset Ticks parameter controls visual presentation without affecting pivot detection logic. This setting shifts triangle markers away from price bars by the specified tick distance, ensuring markers remain clearly visible even on instruments with large candlestick ranges or during high-volatility periods. Traders using busy chart layouts or multiple overlapping indicators benefit from increased offset values that prevent visual clutter.
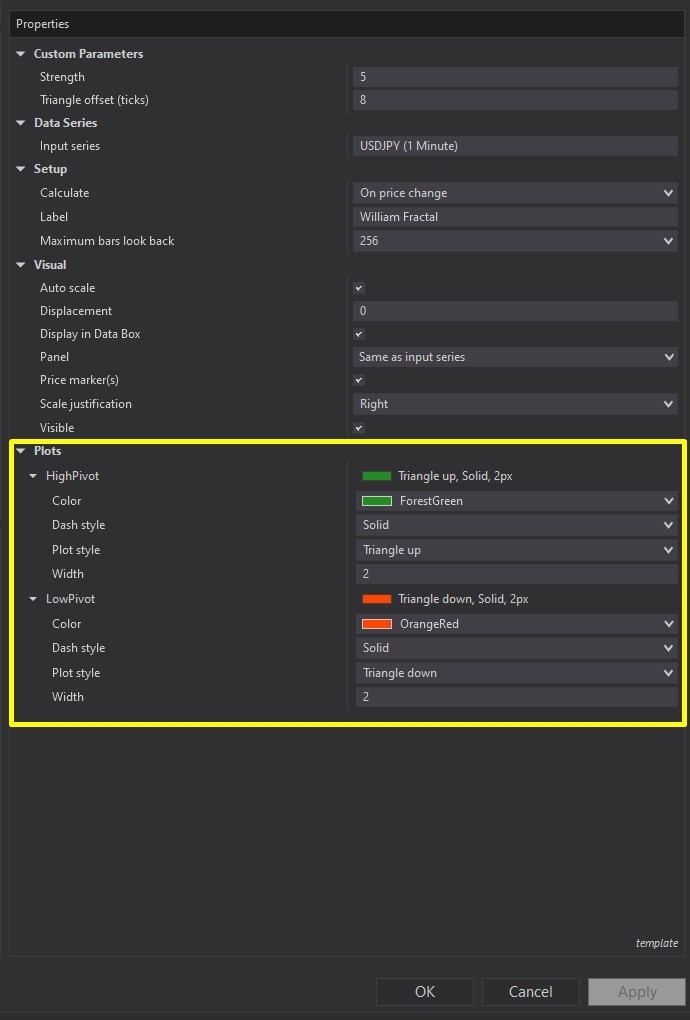
Image 3 displays the Plots configuration options, highlighted by a yellow rectangle. The High Pivot plot represents confirmed swing highs, defaulting to green upward-pointing triangles that immediately communicate bullish pivot identification. Traders can customise the colour, marker style, and line thickness to match personal chart themes or to differentiate from other indicators. The visual clarity of distinct upward triangles makes high pivots instantly recognisable during rapid market analysis.
The Low Pivot plot marks confirmed swing lows, defaulting to orange-red downward-pointing triangles that visually communicate bearish pivot points. Similar customisation options allow colour scheme adjustments, marker style changes, and thickness modifications. The downward triangle orientation provides intuitive visual communication—traders naturally associate downward markers with support levels and potential reversal zones where price found buyers.
These plot outputs serve dual purposes: visual chart analysis for discretionary traders and programmatic data sources for automated strategies. Because William Fractal delivers full NinjaScript source code, developers can reference the High Pivot and Low Pivot plot values directly within custom strategies, using confirmed swing structure as entry filters, stop loss references, breakout triggers, or trailing stop logic based on most recent pivot levels.
With full NinjaScript source code included, advanced users can modify the indicator. If you have questions about the indicator, refer to the comprehensive video tutorial above.

Rize Capital Ltd is an independent NinjaTrader vendor and affiliate. We may earn a commission if you register through our NinjaTrader referral link. Trading carries risk. Always trade responsibly.
Was this article helpful?
That’s Great!
Thank you for your feedback
Sorry! We couldn't be helpful
Thank you for your feedback
Feedback sent
We appreciate your effort and will try to fix the article