
Rize Capital Ltd is an independent NinjaTrader vendor and affiliate. We may earn a commission if you register through our NinjaTrader referral link. Trading carries risk. Always trade responsibly.
Trading Zones With Extension - Premium Indicator
 |
Image - 1 (Click to ZOOM) |
Trading Zones with Extension is a custom programmed indicator to be used on the NinjaTrader 8 platform. This is a leading indicator. It plots the initial balance for the day on the live market (shown with a yellow right arrow with red fill, Image 1). You can choose the start and end time of the initial balance from the settings, as shown in Image 4, marked with a lime green rectangle. At the same time, the extension lines on both sides of the initial balance, which are marked by green and red lines, keep developing. As soon as the initial balance time is up and it stops plotting, it will plot the trading zones on both sides of the initial balance zone, as shown in Image 1, marked with a white down arrow. After the initial balance plots have finished, all these extension lines and trading zone plots remain unchanged. It also plots the initial balance range live (pointed to by a white right arrow with red fill, Image 1).
If you add this indicator to your chart, you will see that the price reacts on the green and red lines (called extension lines), and if the price goes on to the trading zones, it will give you high-probability trading opportunities.
 |  |
Image - 2 (Click to ZOOM) | Image - 3 (Click to ZOOM) |
Now, you can choose to plot these zones and lines for every day's data on your chart by checking the ‘Repeats Daily’ checkbox as shown in Image 2, or you can select specific days by checking the checkboxes beside the specific day's name, as shown by the red rectangle in Image 3.
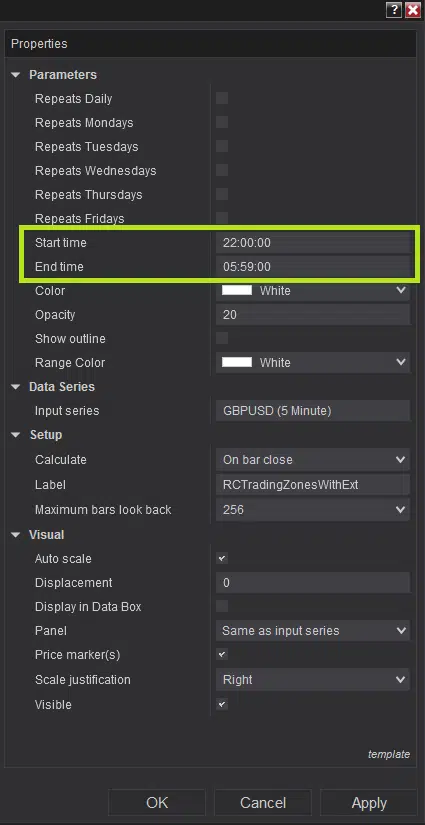 | 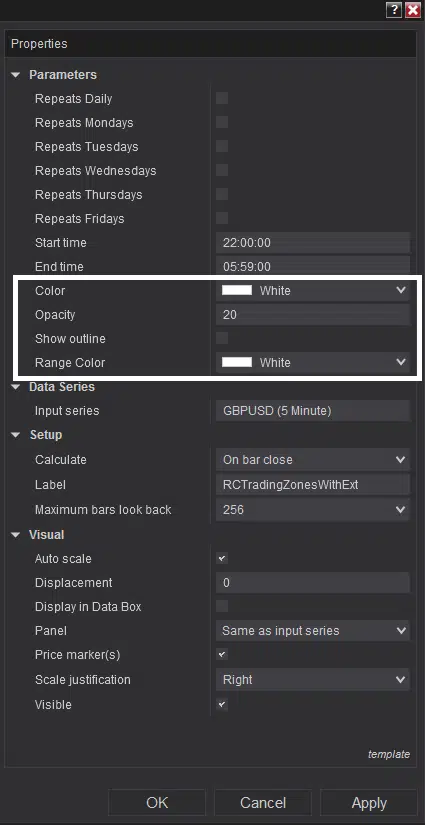 | 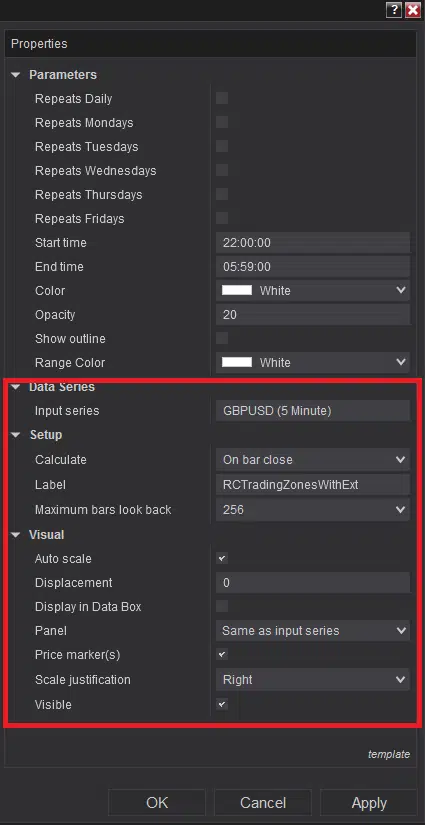 |
Image - 4 (Click to ZOOM) | Image - 5 (Click to ZOOM) | Image - 6 (Click to ZOOM) |
If you want to customise the plots’ colours, opacity, etc., you can do that from the parameters marked with the white rectangle in Image 5. It is highly recommended not to change the settings marked with the red rectangle in Image 6.
If you still have any further queries, please do watch the video tutorial by clicking here.

Rize Capital Ltd is an independent NinjaTrader vendor and affiliate. We may earn a commission if you register through our NinjaTrader referral link. Trading carries risk. Always trade responsibly.
Was this article helpful?
That’s Great!
Thank you for your feedback
Sorry! We couldn't be helpful
Thank you for your feedback
Feedback sent
We appreciate your effort and will try to fix the article