
Rize Capital Ltd is an independent NinjaTrader vendor and affiliate. We may earn a commission if you register through our NinjaTrader referral link. Trading carries risk. Always trade responsibly.
Free Multi Time Frame Trend Line - Free Indicator
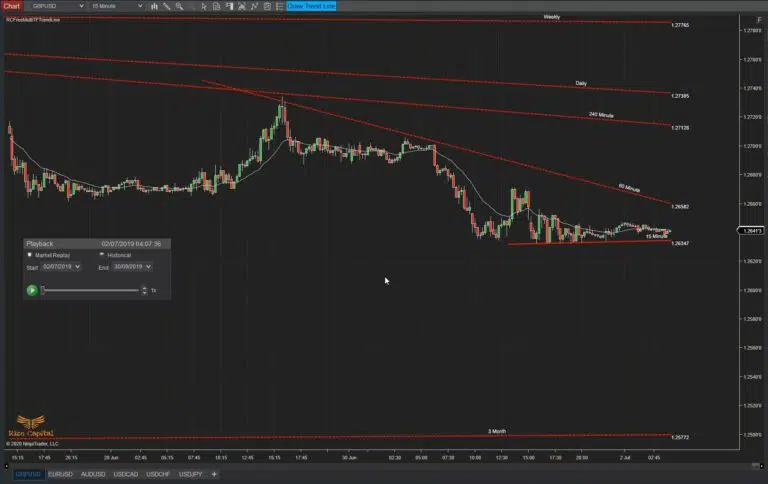 |
Image - 1 (Click to ZOOM) |
This FREE for lifetime NinjaTrader 8 indicator is one of the most popular tools on the market. This is the free version of our premium “Multi Time Frame Trend Line” indicator, which includes additional features. With this tool, you can draw trendlines (TL) across different timeframes (TF) of the same instrument, enabling you to assess the overall market trend at a glance without altering the chart’s timeframe. The indicator works with any instrument, but we recommend using it to draw trendlines on 15-minute, hourly, 4-hourly, daily, weekly, monthly, and quarterly timeframe charts. If certain TF trendlines are unnecessary, you can skip them—it’s entirely up to you which ones align with your trading or investment strategy. As this indicator is completely FREE forever, you can subscribe to it at no cost.
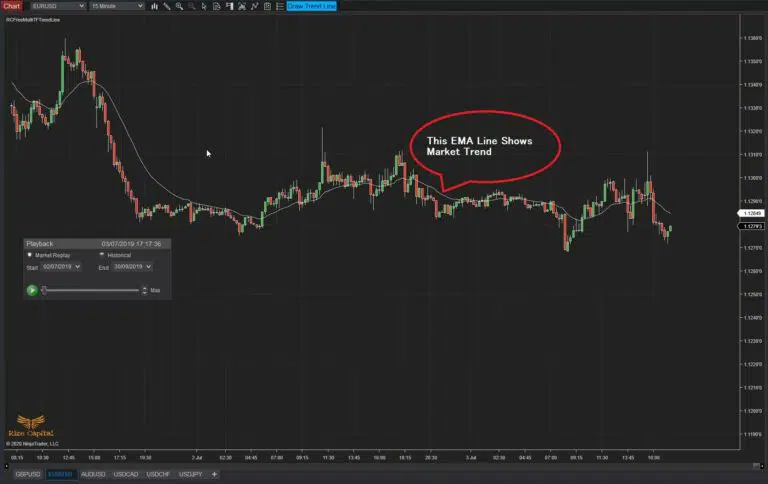 | |
Image - 2 (Click to ZOOM) | Image - 3 (Click to ZOOM) |
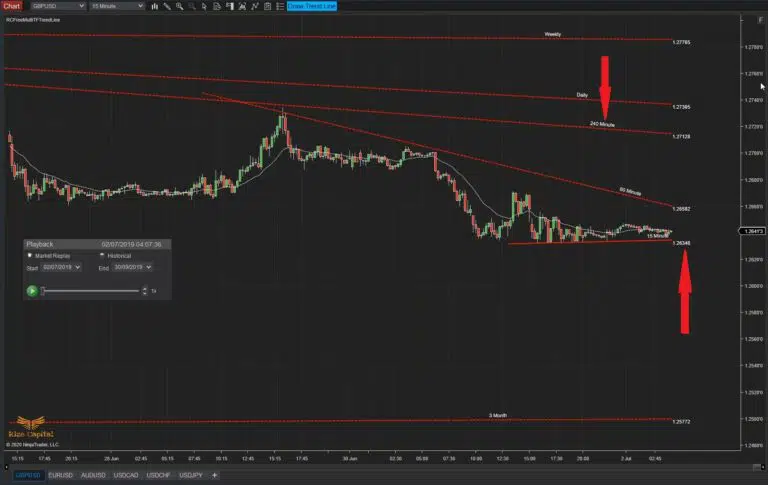 | |
Image - 4 (Click to ZOOM) | Image - 5 (Click to ZOOM) |
Every trend line drawn also plots a label of the TF where it is drawn, along with price labels at the right edges (Image 2; red upward and downward arrows). This indicator also plots an EMA line to show you the current market trend alongside the trend lines (as marked in Image 3). If you change the chart’s TF, the EMA line’s plot will adjust accordingly. Since it’s impossible to monitor charts 24/7, when an Up Trend Line breaks, it stops plotting further (indicated by a red left arrow in Image 4) and plots a downward red arrow above the bar that broke the trend line (marked with a white circle in Image 4). For a down trend line break, it plots an upward blue arrow and stops plotting the trend line (Image 5).
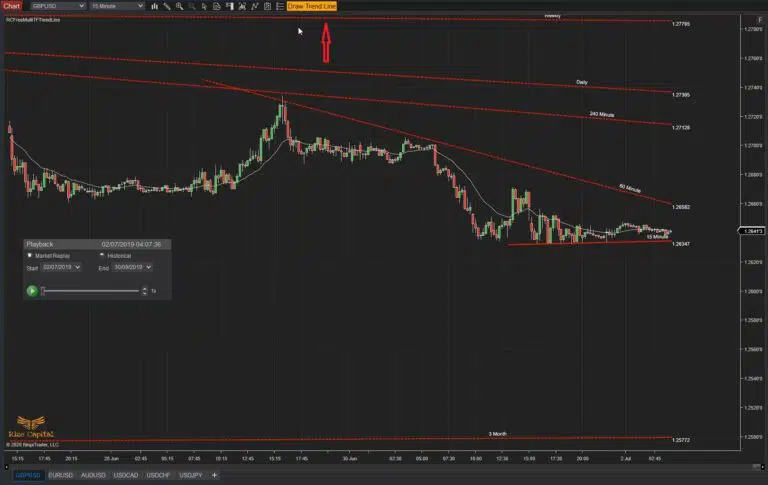 | 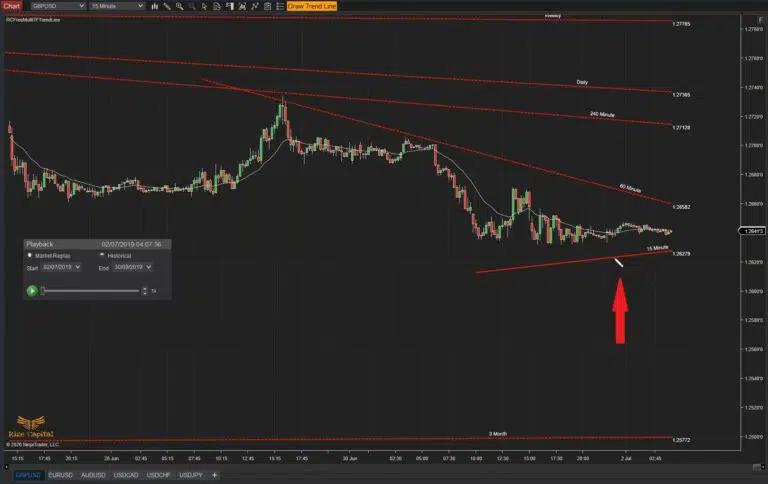 |
Image - 6 (Click to ZOOM) | Image - 7 (Click to ZOOM) |
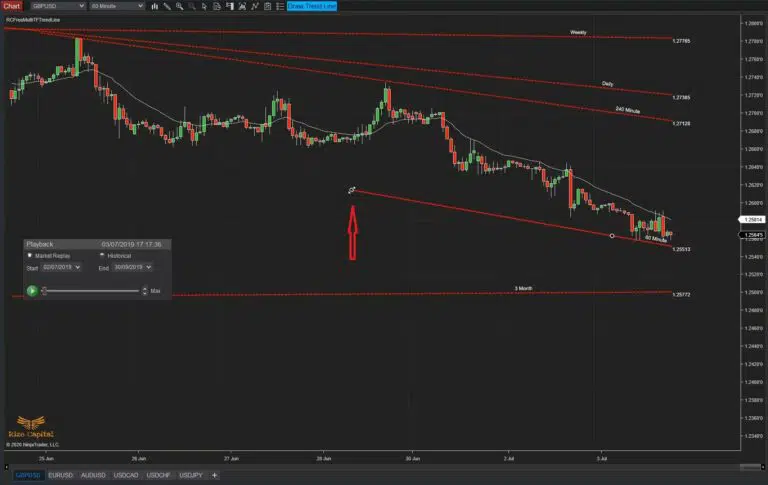 | 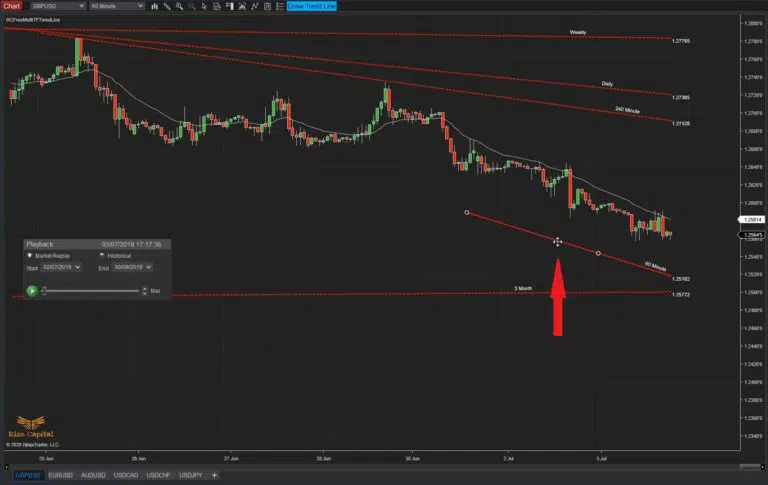 |
Image - 8 (Click to ZOOM) | Image - 9 (Click to ZOOM) |
To draw a trend line, click the “Draw Trend Line” button at the top of the chart window, which will change its colour (as shown in Image 6). Using your cursor, draw the trend line anywhere on the chart (Image 7). To begin, left-click on the starting point and release the mouse button. Move the cursor to your desired direction, then left-click again to place the second point. All trend lines are drawn as rays extending automatically to the right, so you don’t have to extend them manually. To adjust the trend line’s direction, hover the cursor over the leftmost point (marked with an upward arrow in Image 8). When the cursor changes, hold left-click to grab the point, adjust the direction as needed, and release the mouse button again to finalise. Note: Click once to grab, then release the click. Then move as you wish and left-click again to plot the left corner of the trend line when you are happy with the direction. To move the trend line parallel to its original position, hover the cursor anywhere on top of the line until it changes (as in Image 9). Left-click and release, drag it to the new location, and left-click again to lock it in place.
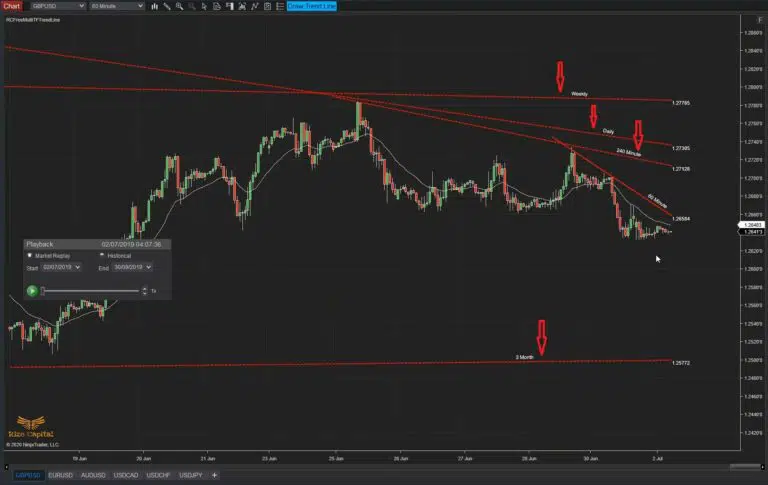 | 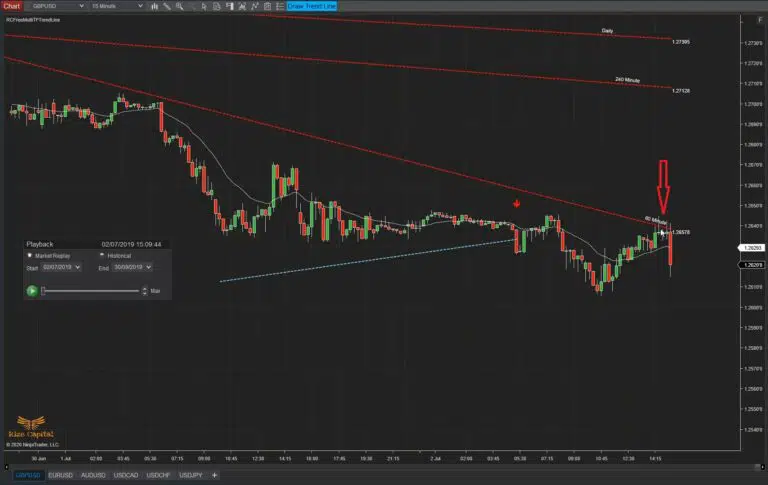 |
Image - 10 (Click to ZOOM) | Image - 11 (Click to ZOOM) |
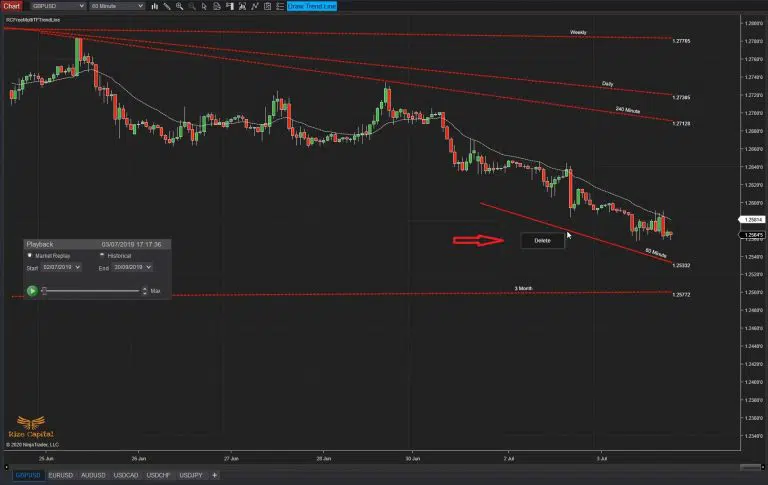 | |
Image - 12 (Click to ZOOM) | Image - 13 (Click to ZOOM) |
To delete a trend line, simply right-click on it, which will display the “Delete” option (as shown in Image 10). Left-click on “Delete” to remove the trend line from the chart. As discussed earlier, broken trend lines are plotted as dotted blue lines by default (Image 11). If preferred, you can customise their colour to match your platform’s skin or chart theme, as explained in the settings section below. A key point to remember: Higher TF trend lines are visible on lower TF charts, but lower TF trend lines do not appear on higher TF charts (Image 12), as they do not significantly impact higher timeframe market trends. If a higher TF trend line breaks while viewing a lower TF chart, it will not register as broken, as trend lines are only broken when the chart TF matches the trend line TF (indicated by a red downward arrow in Image 13).
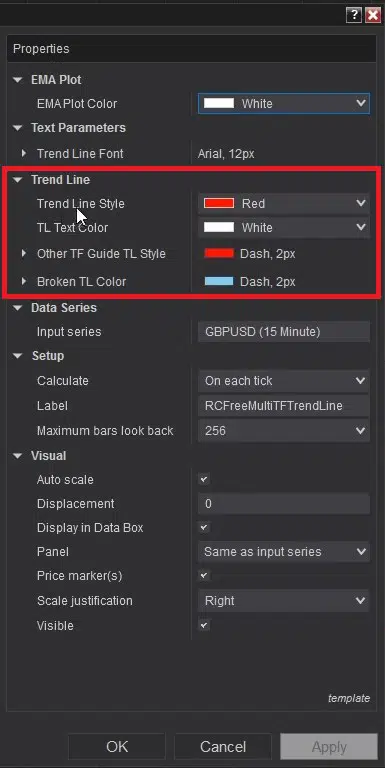 | 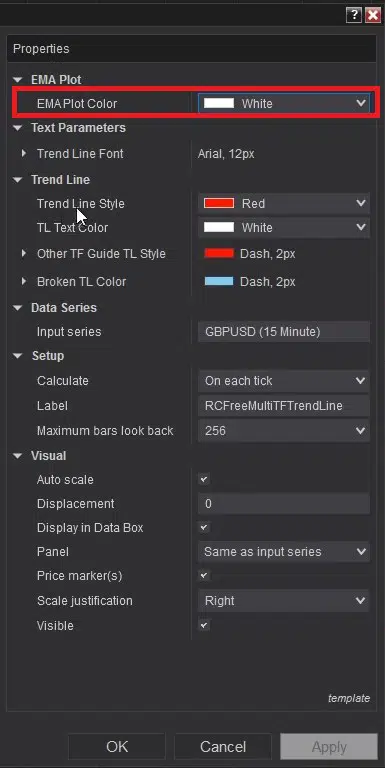 | 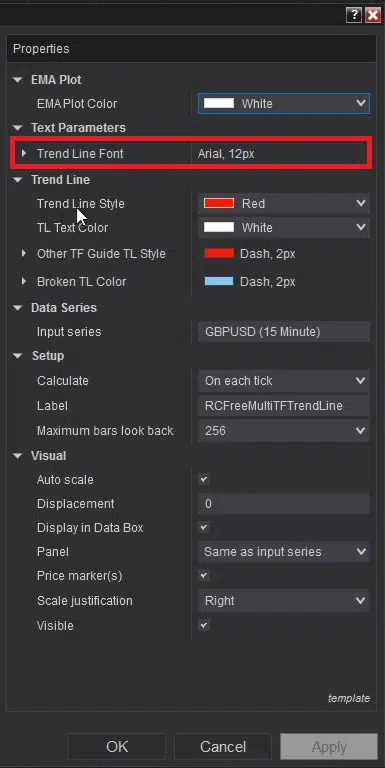 |
Image - 14 (Click to ZOOM) | Image - 15 (Click to ZOOM) | Image - 16 (Click to ZOOM) |
To change the colour of the EMA line plotted on your chart, navigate to the “EMA Plot” option in the settings (as shown in Image 14, highlighted with a red rectangle). Depending on your chart’s aesthetics, you may also adjust the font and its size for trend line labels via the “Trend Line Font” text settings (highlighted in Image 15). To customise the colours of trend lines, fonts, other TF trend lines, or broken trend lines, modify these parameters in the section highlighted within a red rectangle in Image 16.
If you still have any further queries, please do watch the video tutorial by clicking here.

Rize Capital Ltd is an independent NinjaTrader vendor and affiliate. We may earn a commission if you register through our NinjaTrader referral link. Trading carries risk. Always trade responsibly.
Was this article helpful?
That’s Great!
Thank you for your feedback
Sorry! We couldn't be helpful
Thank you for your feedback
Feedback sent
We appreciate your effort and will try to fix the article